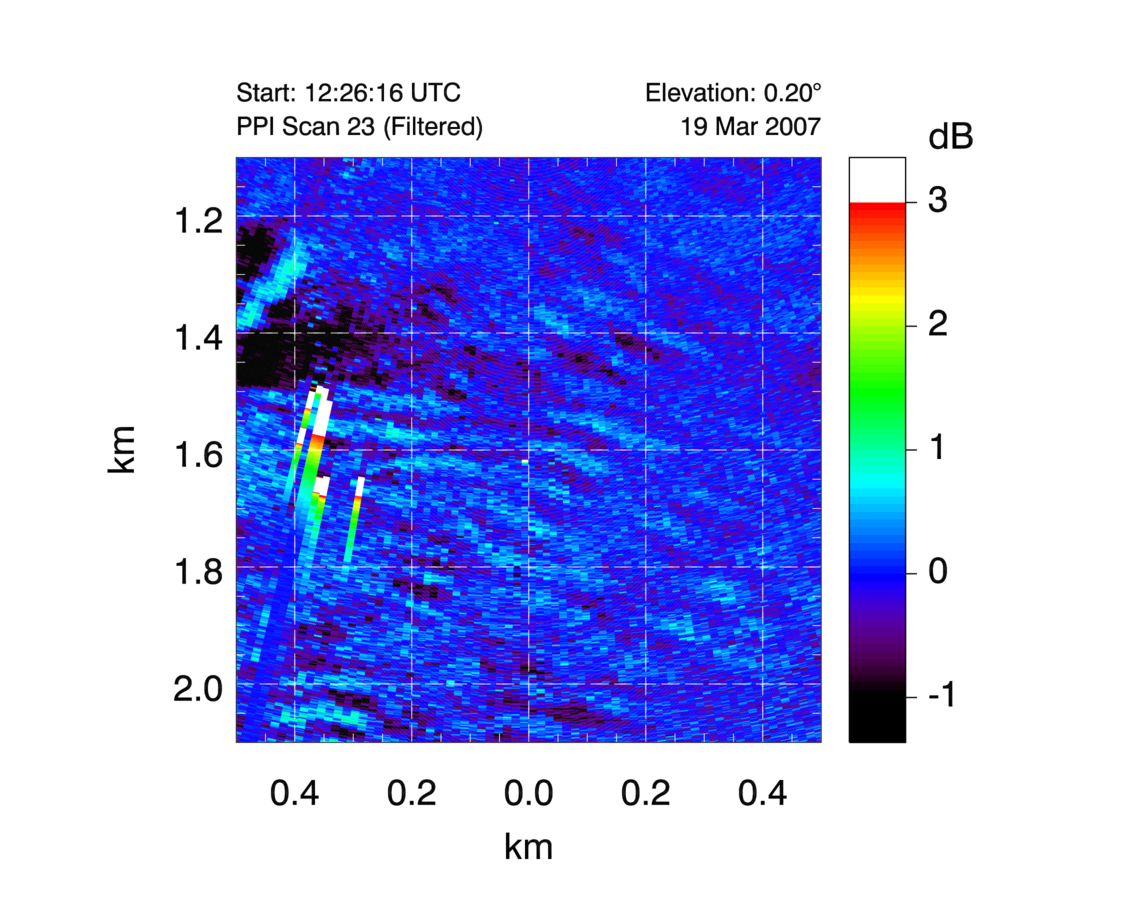
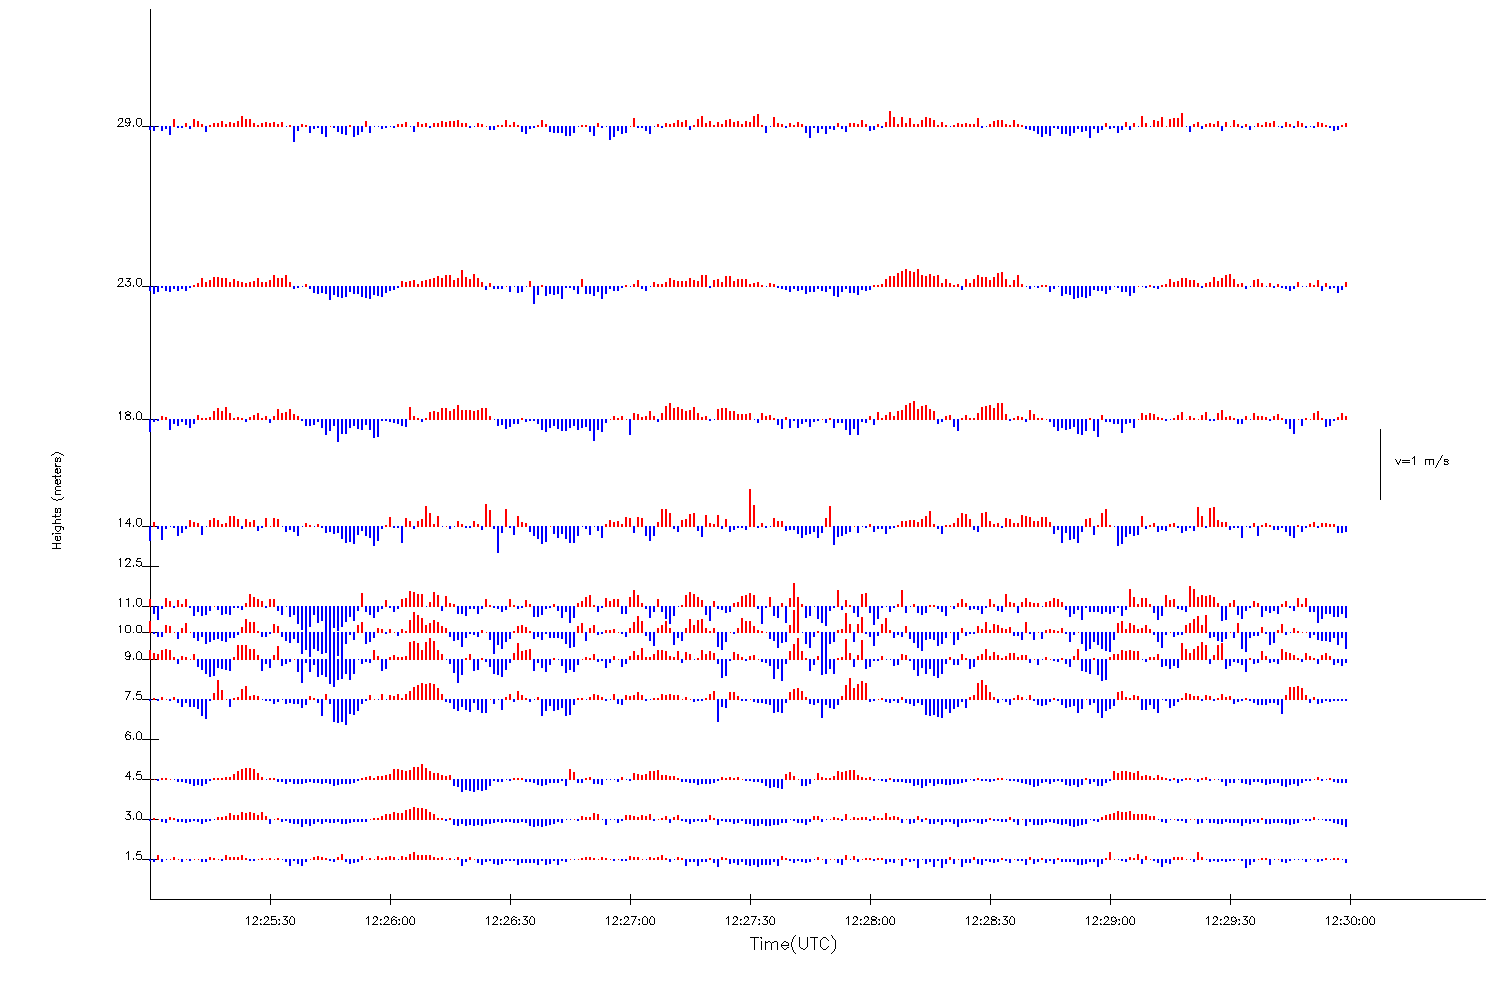
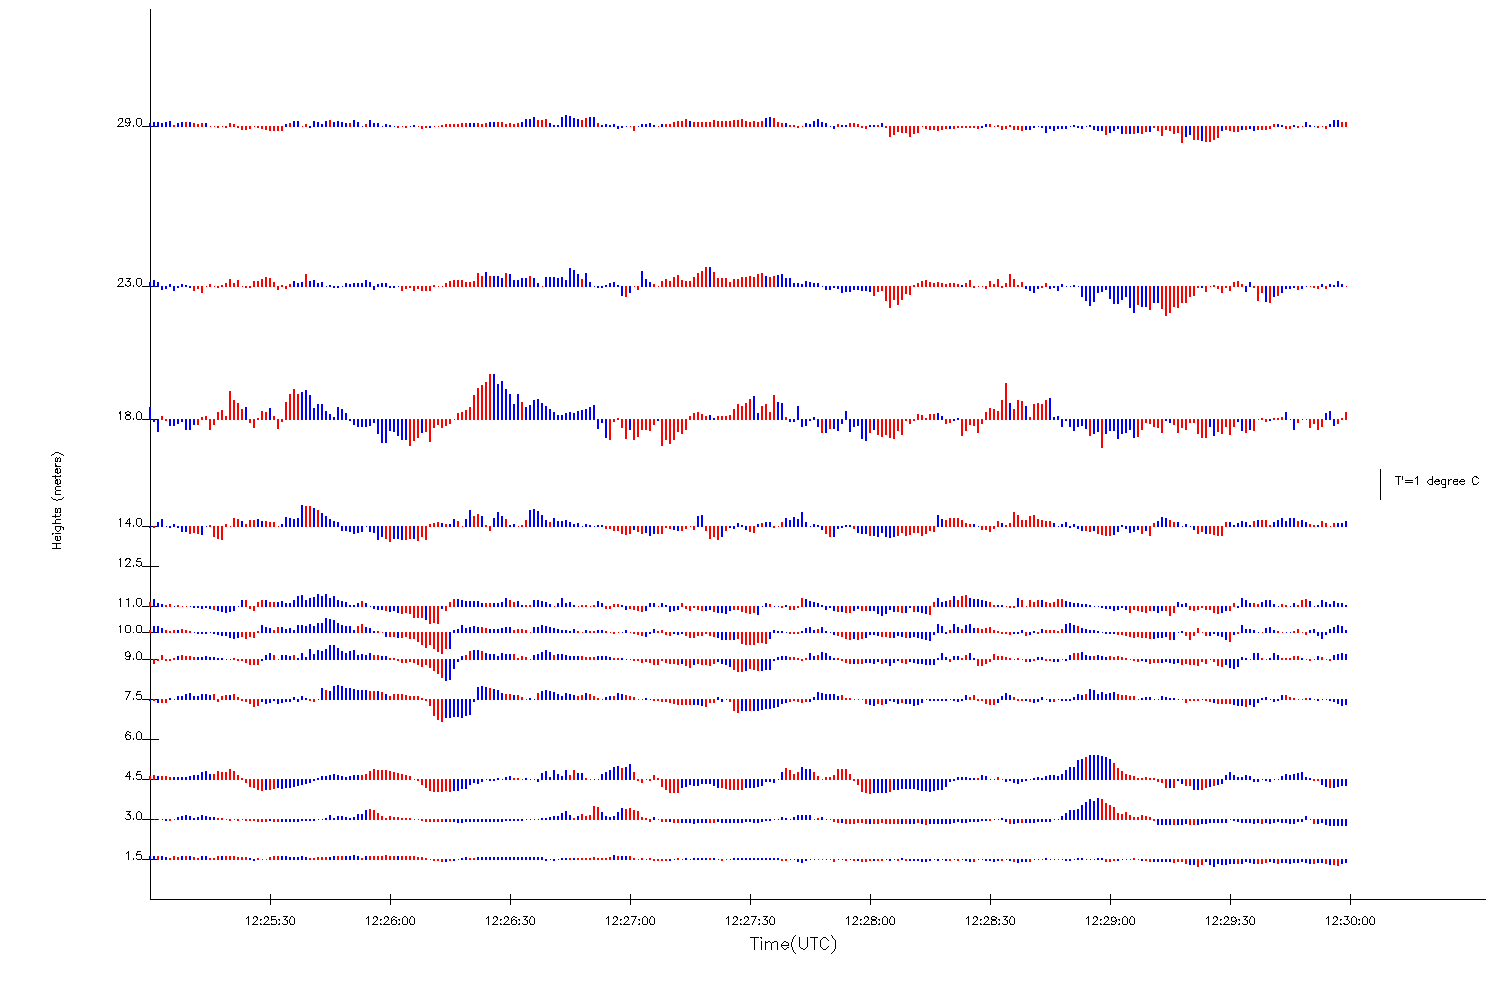
Wave Episode: 19 March 2007 12:25:25 12:28:17 UTC |
||
|---|---|---|
 |
|
 |
| (5 min span) |
(5 min span) |
(5 min span) |
 |
 |
 |
| (5 min span) |
(5 min span) |
|
 |
 |
|
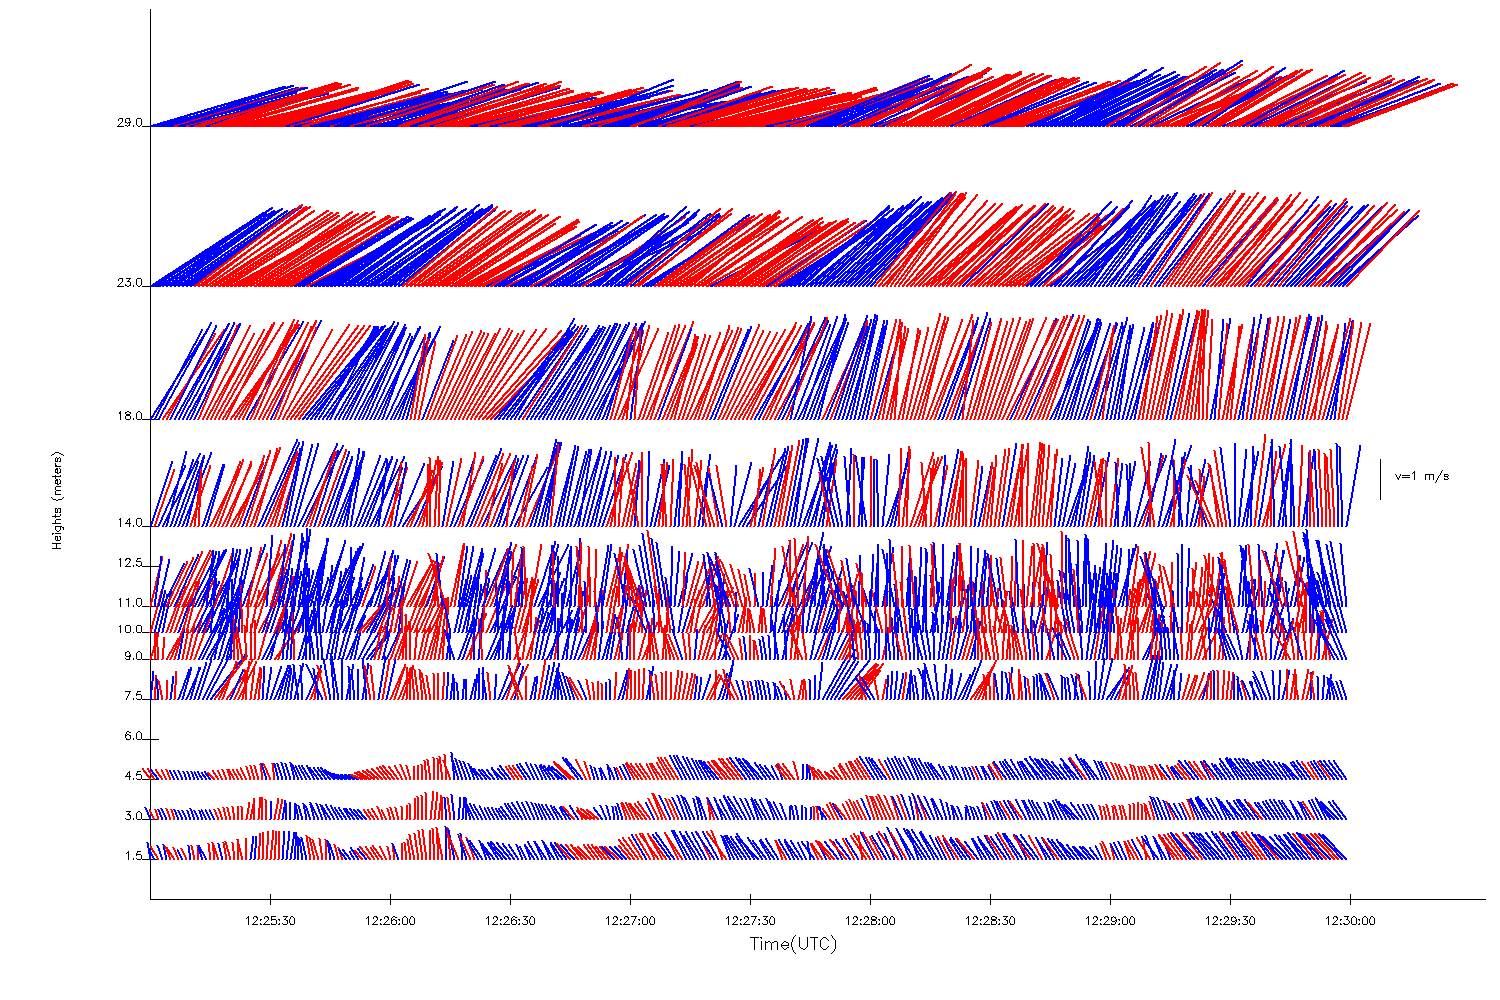
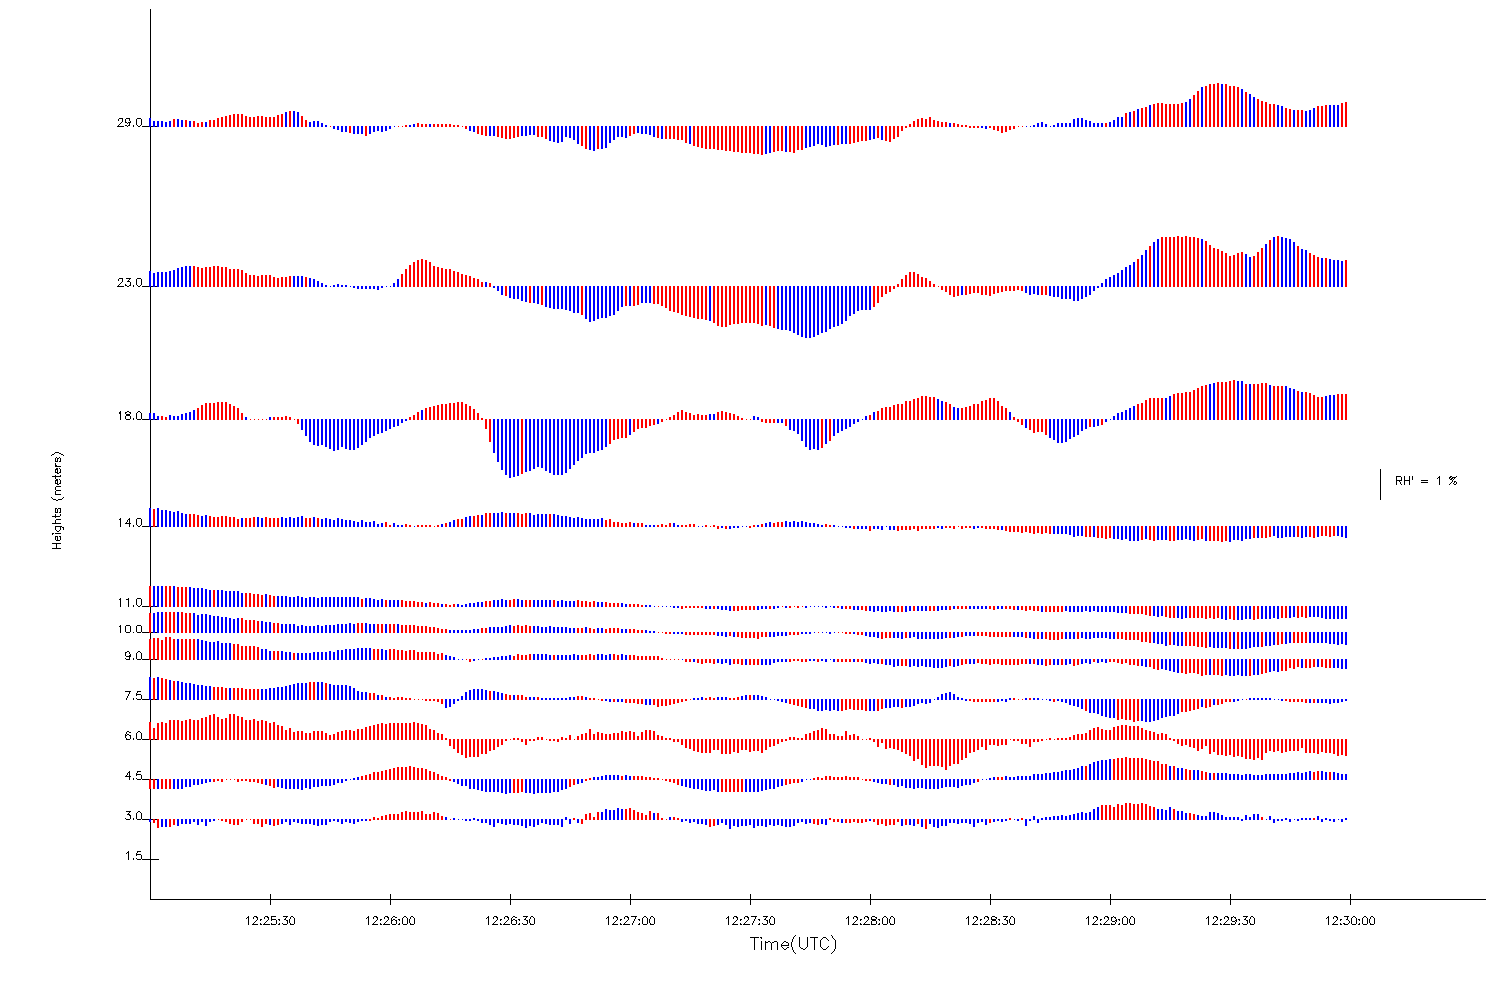
Wave Episode: 19 March 2007 12:25:25 12:28:17 UTC |
||
|---|---|---|
| |
|
|
| (5 min span) |
(5 min span) |
(5 min span) |
|
|
|
| (5 min span) |
(5 min span) |
|
|
|
|