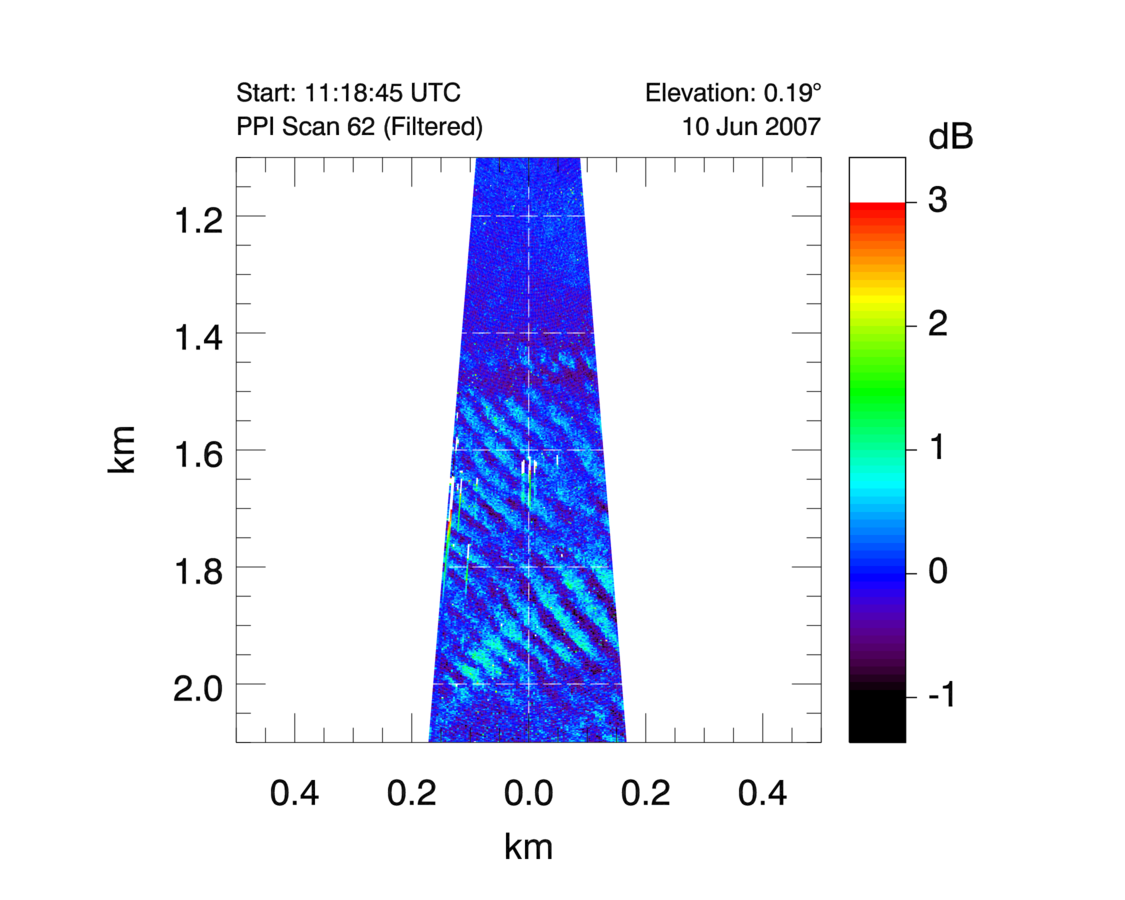
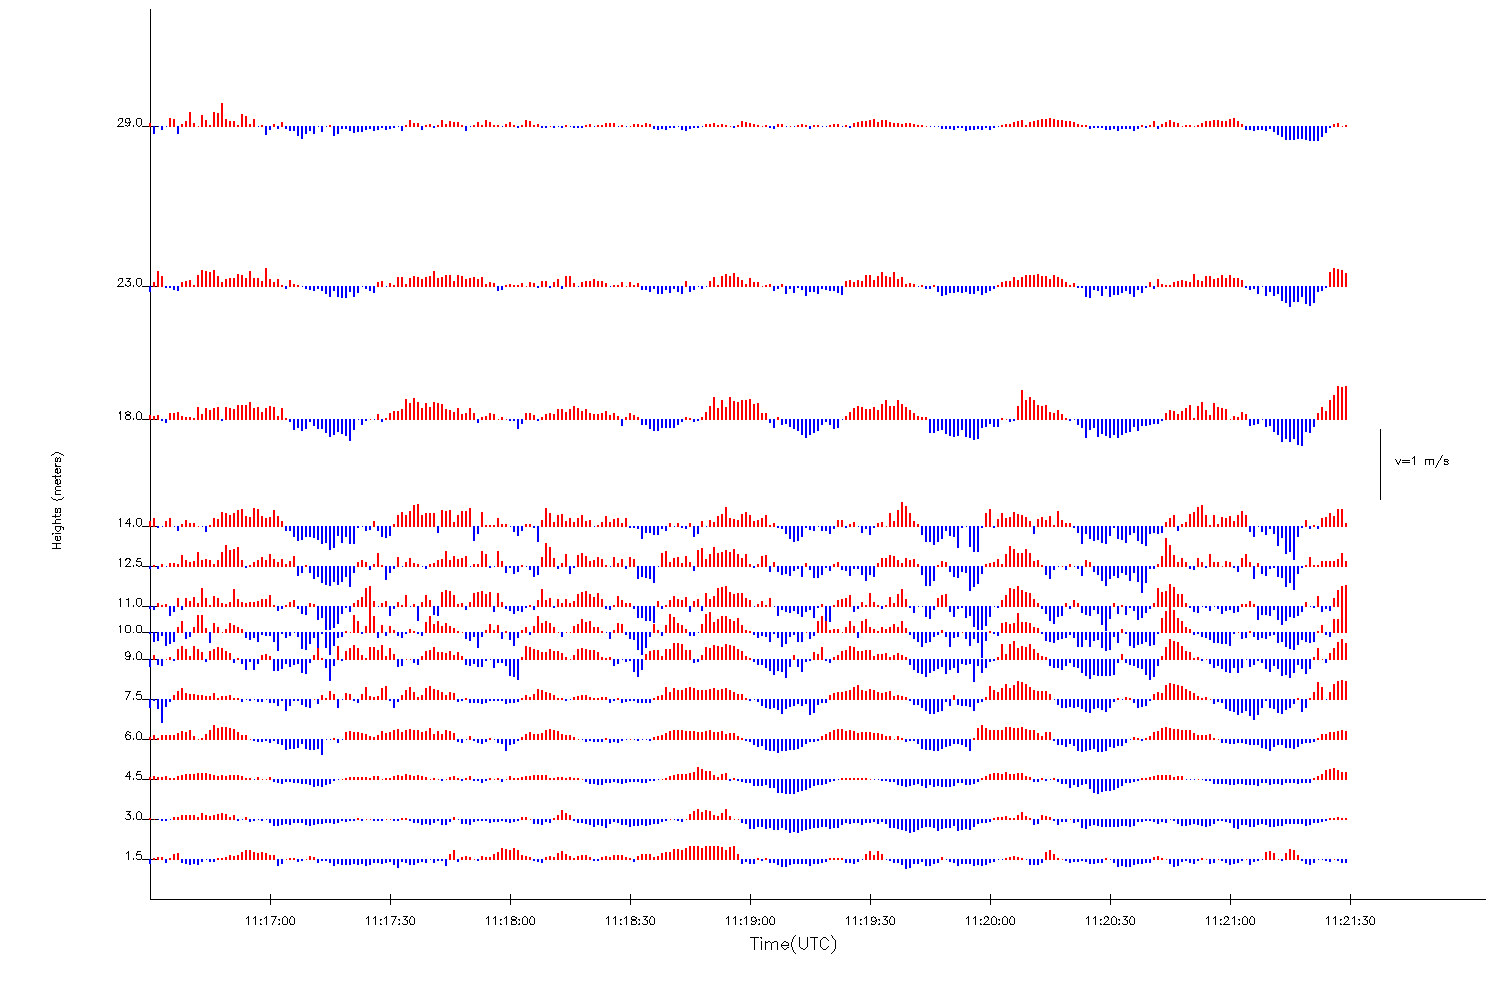
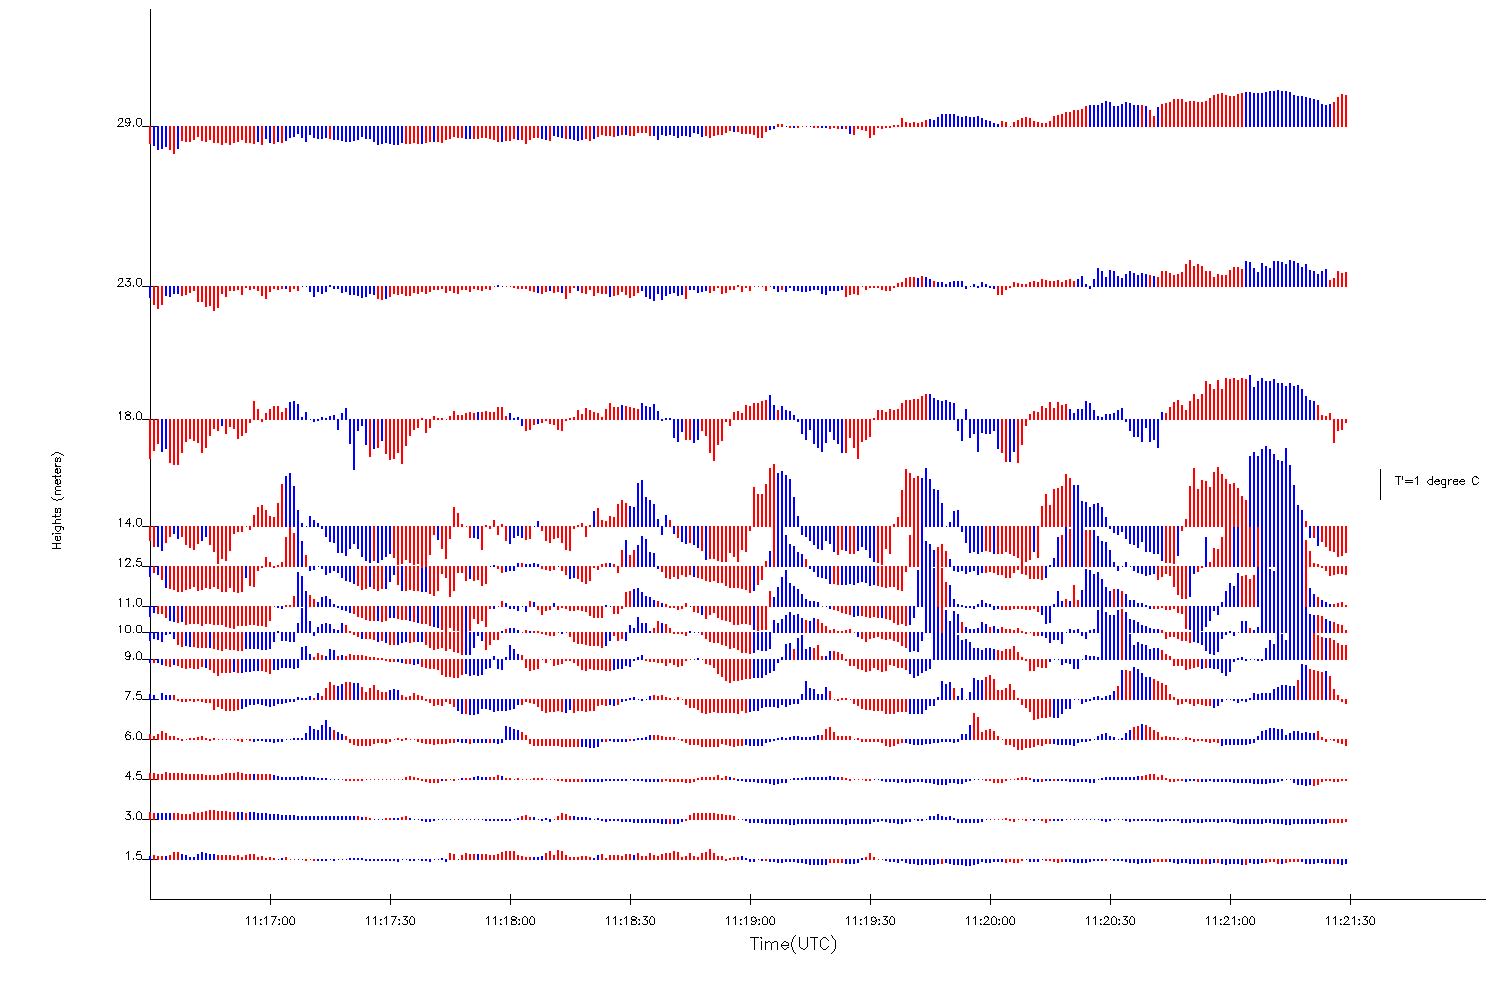
Wave Episode: 10 June 200710:50:06 11:21:50 UTC |
||
|---|---|---|
|
|
 |
| (5 min span) |
(5 min span) |
|
 |
 |
 |
| (5 min span) |
(5 min span) |
|
 |
 |
|
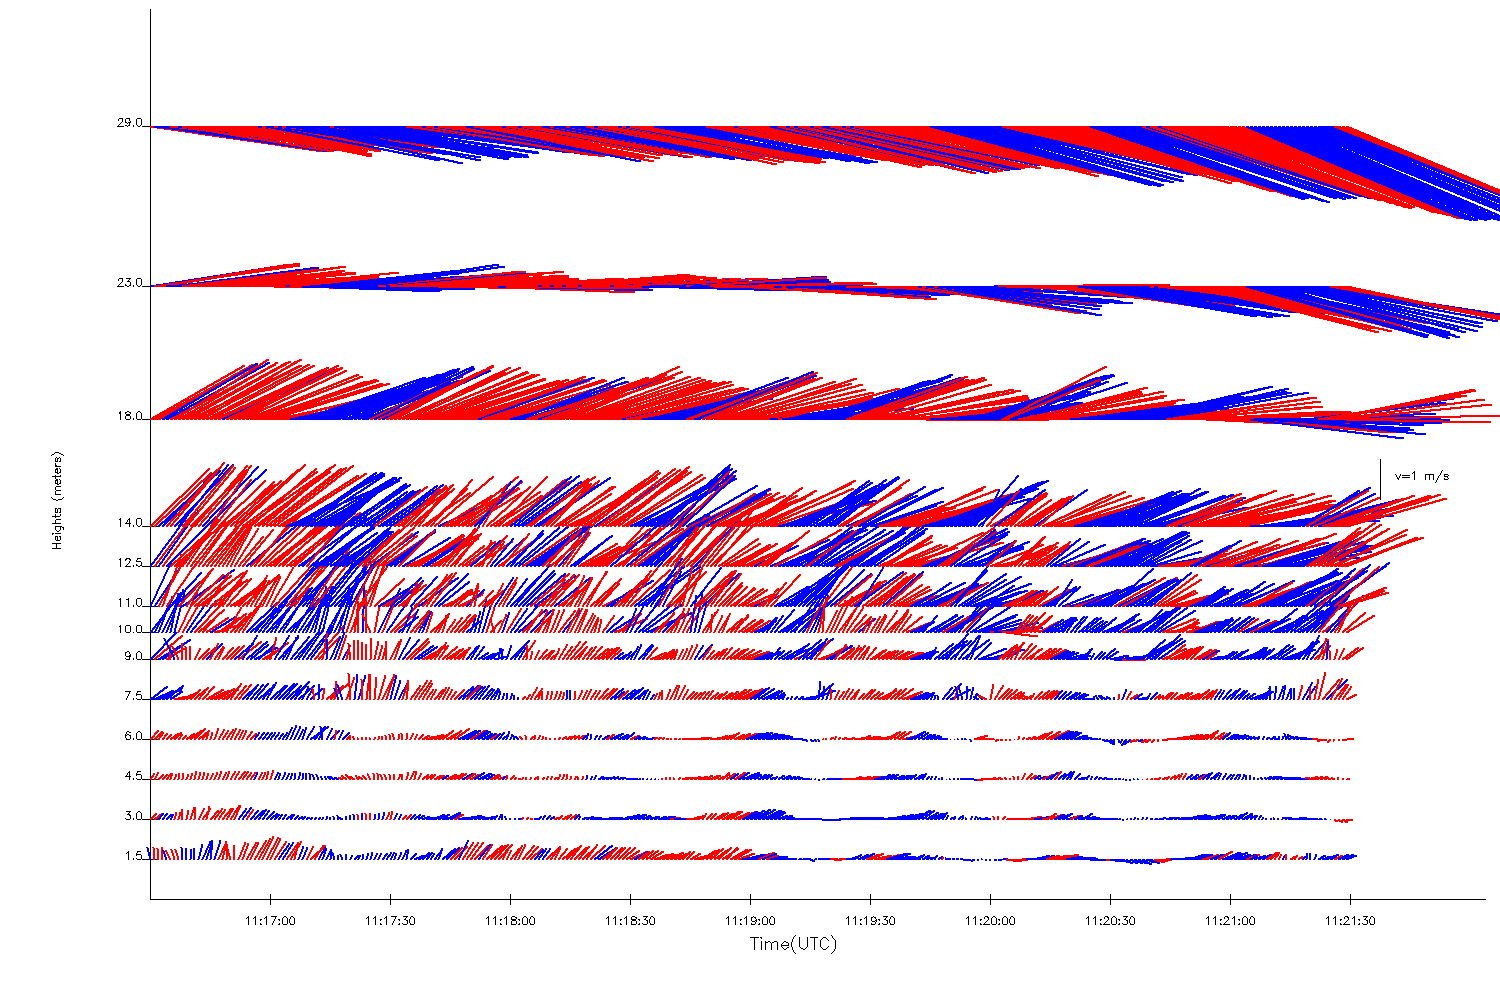
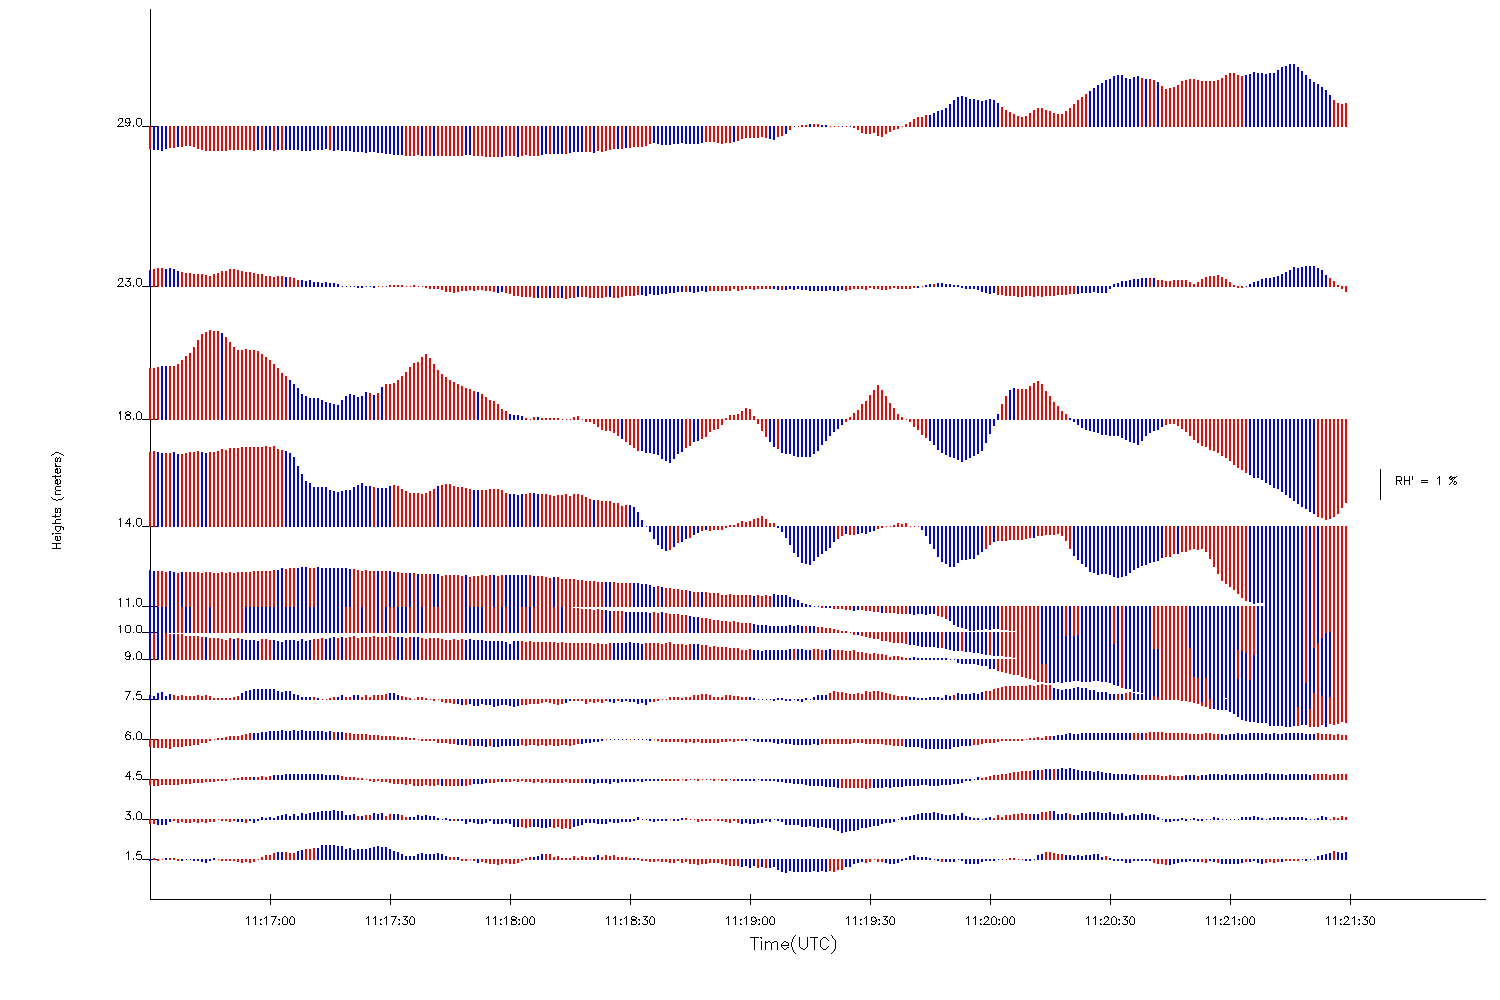
Wave Episode: 10 June 200710:50:06 11:21:50 UTC |
||
|---|---|---|
|
|
|
|
| (5 min span) |
(5 min span) |
|
|
|
|
| (5 min span) |
(5 min span) |
|
|
|
|