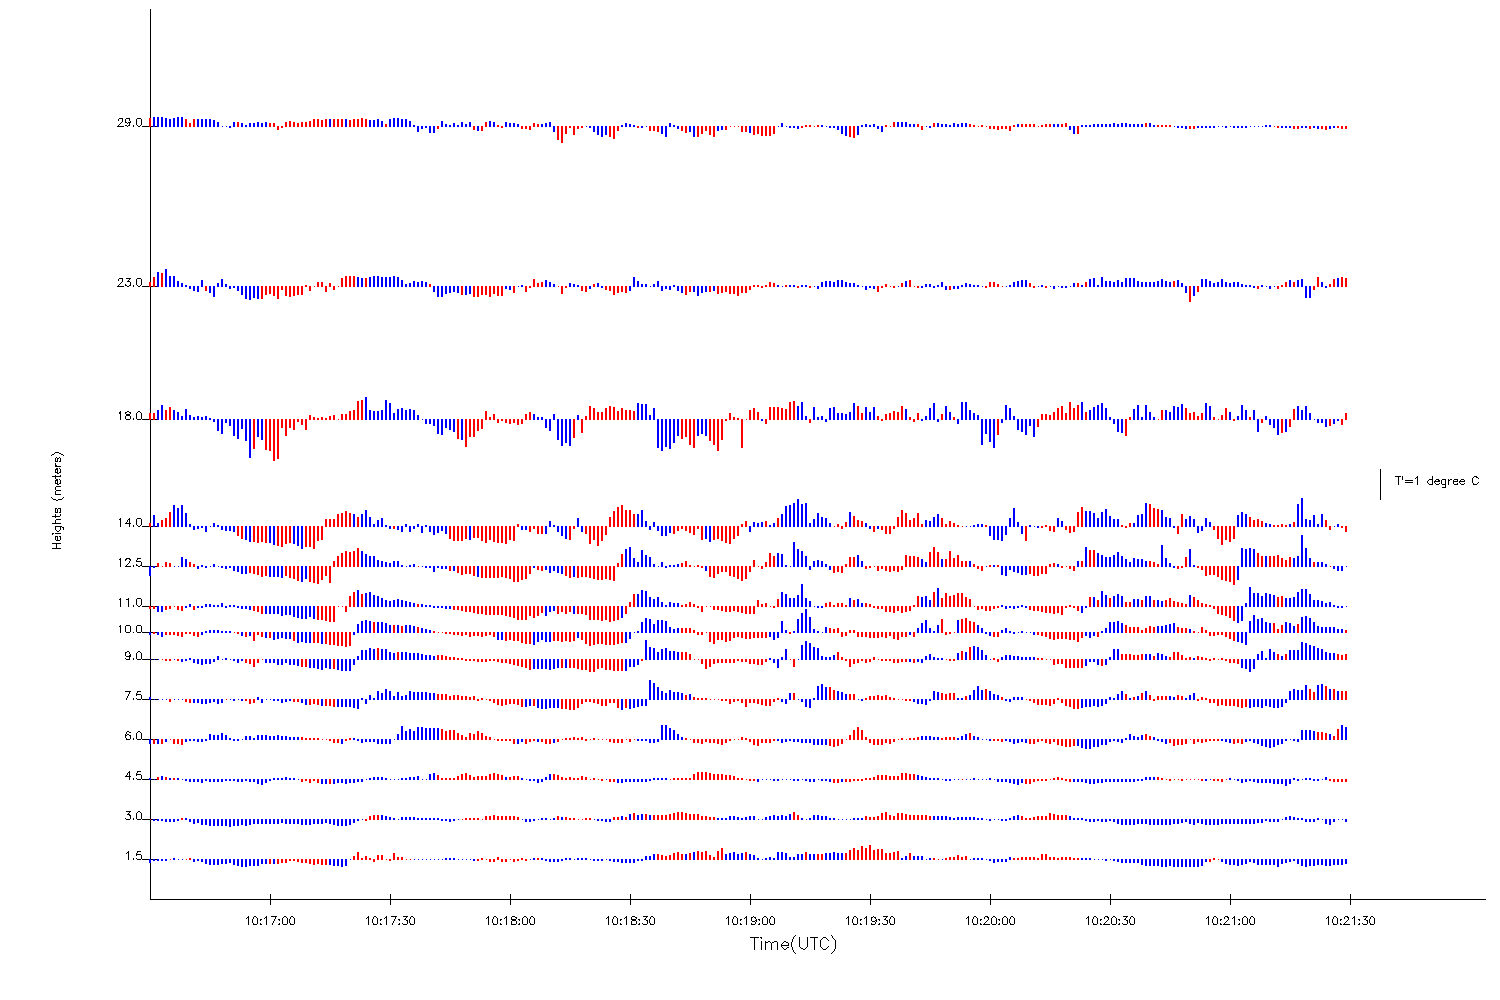
Wave Episode: 11 June 200709:41:55 10:37:07 UTC |
||
|---|---|---|
|
|
 |
| (5 min span) |
(5 min span) |
|
 |
 |
 |
| (5 min span) |
(5 min span) |
|
 |
 |
|
Previous
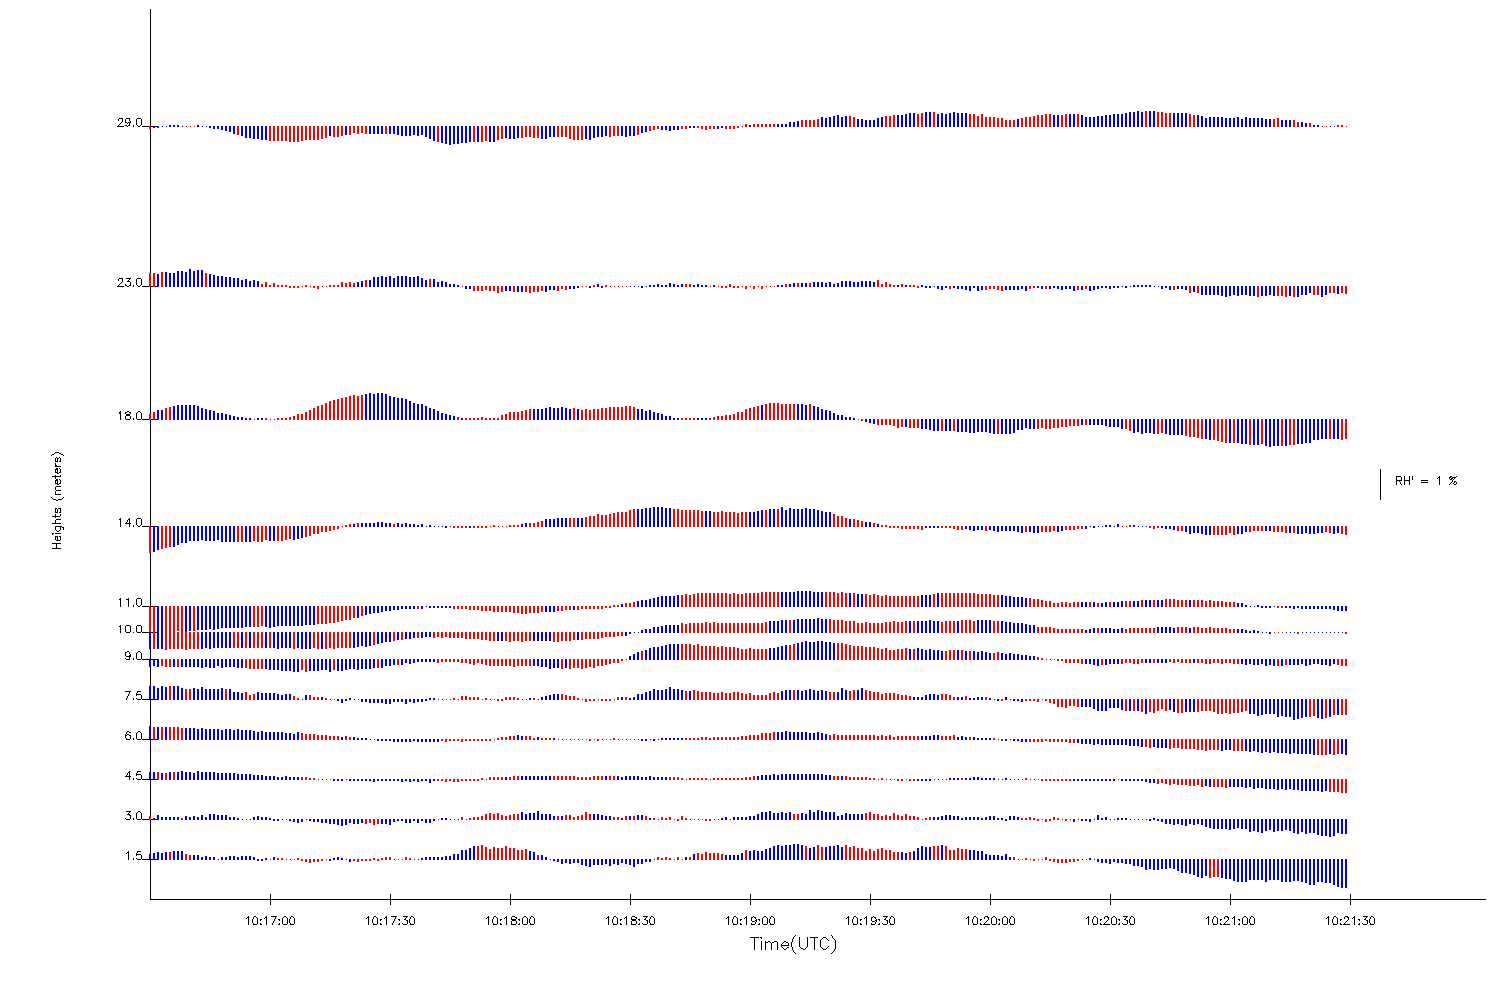
Wave Episode: 11 June 200709:41:55 10:37:07 UTC |
||
|---|---|---|
|
|
|
|
| (5 min span) |
(5 min span) |
|
|
|
|
| (5 min span) |
(5 min span) |
|
|
|
|