Showing wind speed/direction time-series comparison
Wavelet-based optical-flow estimates (orange) from the REAL,
Cross-correlation estimates (green).
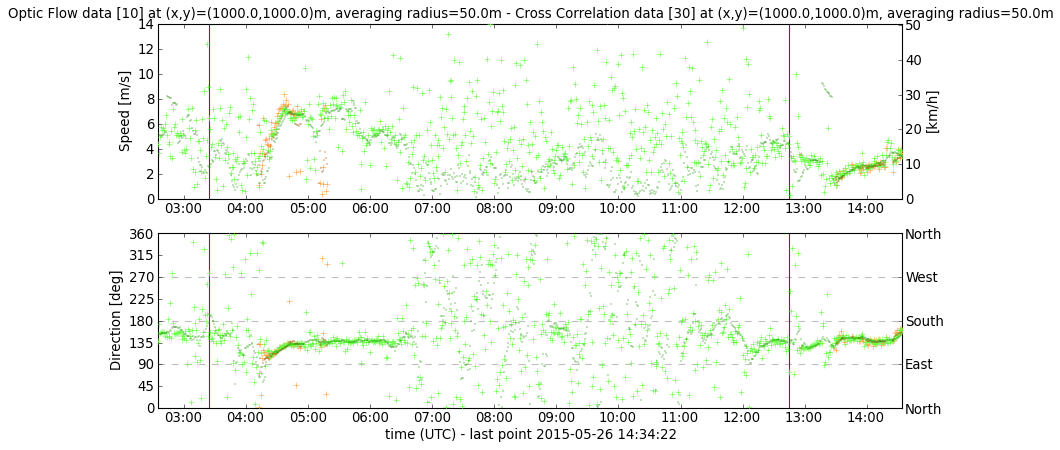
Light + are instantaneous measurements;
Dark · are the 10-minute averaged quantities from data preceding current point - hence the "delay".
Green data is cross correlation estimates from REAL imagery.
Vertical lines denote the Sun rising, transit (noon) and setting times.